2021.9.22 last updated
Five Minutes Experience of Z-Rietveld and Z-3D using a sample file #1 (LaB6)
- starting Z-Rietveld by double click the icon
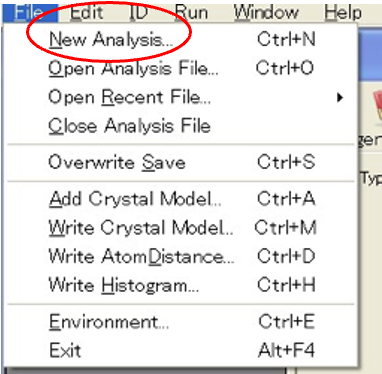
- File Menu -> New Analysis
- Click ‘Add Histogram file’ and specify a histogram file (diffraction data) with the name of‘LaB6_LaboratoryXRD.histogramIgor’ in the Z-Rietveld Sample data #1.
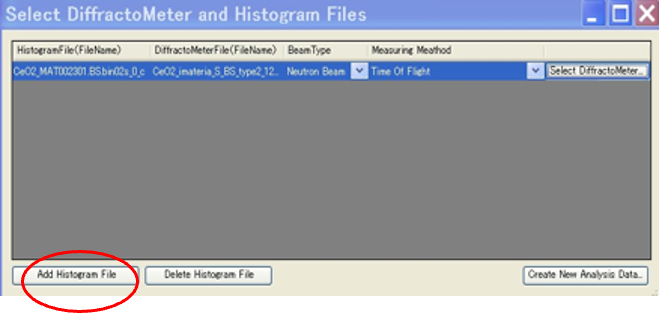
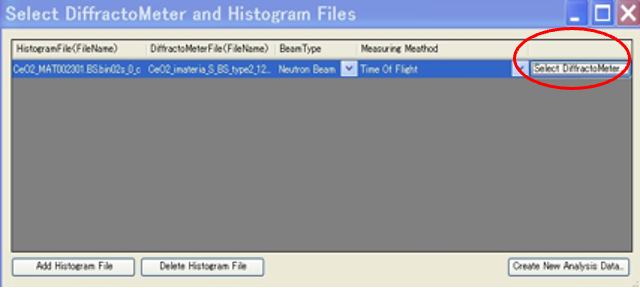
- Click ‘Select Diffractometer’ and specify a diffractometer file (the diffractometer information included) with the name of ‘LabXRD_for_LaB6_160328.zDiffractometer’ in the above Z-Rietveld Sample data #1.
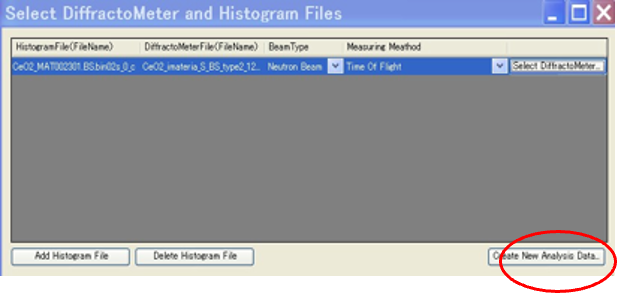
- Click ‘Create New Analysis Data…’, and push return key. Then a file with a name of LabXRD_for_LaB6_160328.zrietveld is created (default file name). All of your analysis results will be stored in LabXRD_for_LaB6_160328.zrietveld. After LabXRD_for_LaB6_160328.zrietveld is created, a ‘diffraction pattern window’ is displayed.
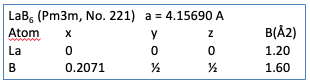
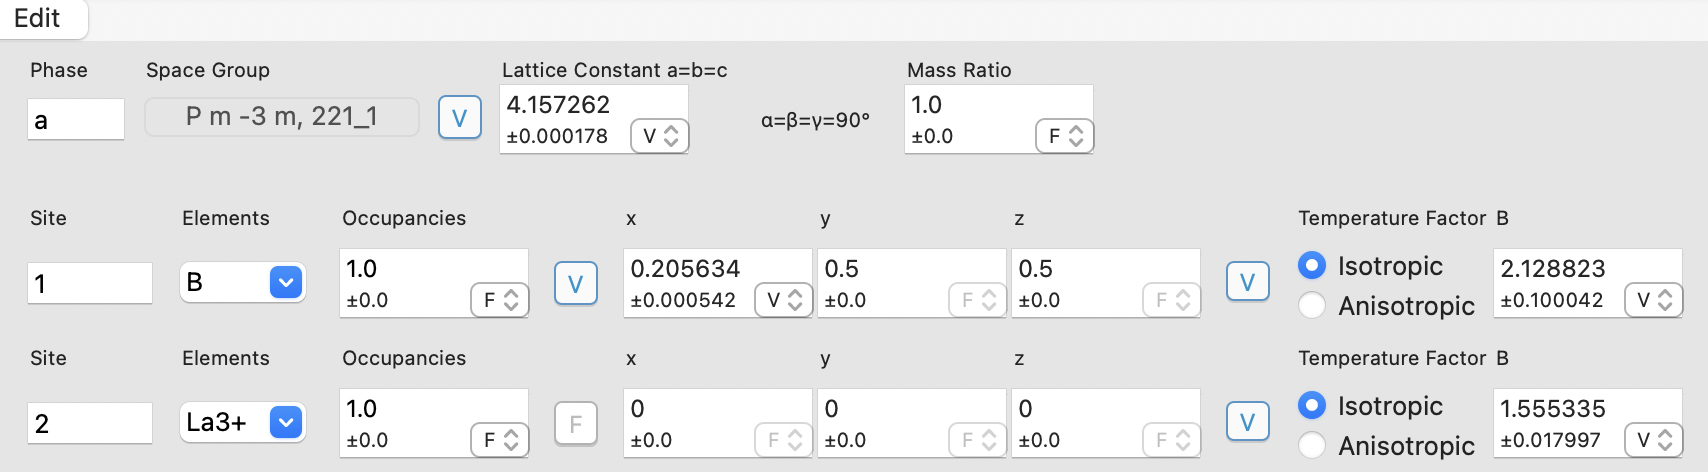
- Input & Edit crystal structure parameters
The crystal structure parameters can be input either by hand or from files. But, here, read crystal structure data from either LaB6_110107.zdf or LaB6_LaboratoryXRD6_a.cif.
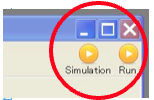
- Execute Rietveld analysis.
By pushing these buttons, you can execute simulation and/or Rietveld analysis. The first push is to ‘generate crystallographic constraints’, and the second push is to ‘generate reflections’. By the third pushing ‘Run’ button, you can start Rietveld analysis.
- Examine the analysis results.
You can find the result in Log in two ways.
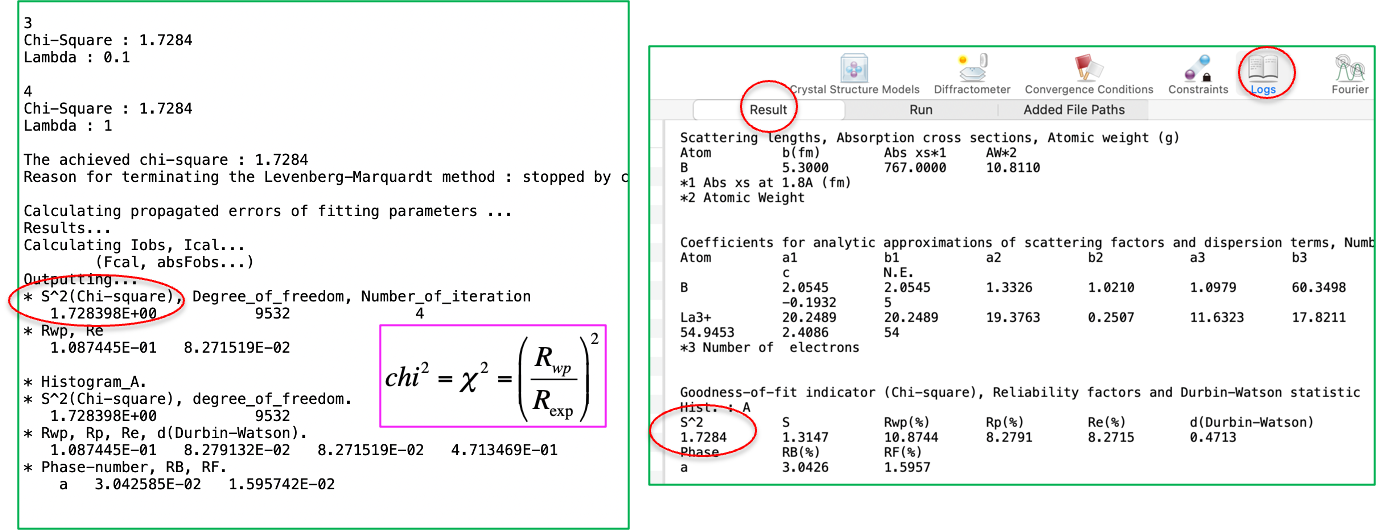
It is strongly recommended you carefully check the Rietveld fitting pattern: enlarging patterns give valuable information.
- Output your results.
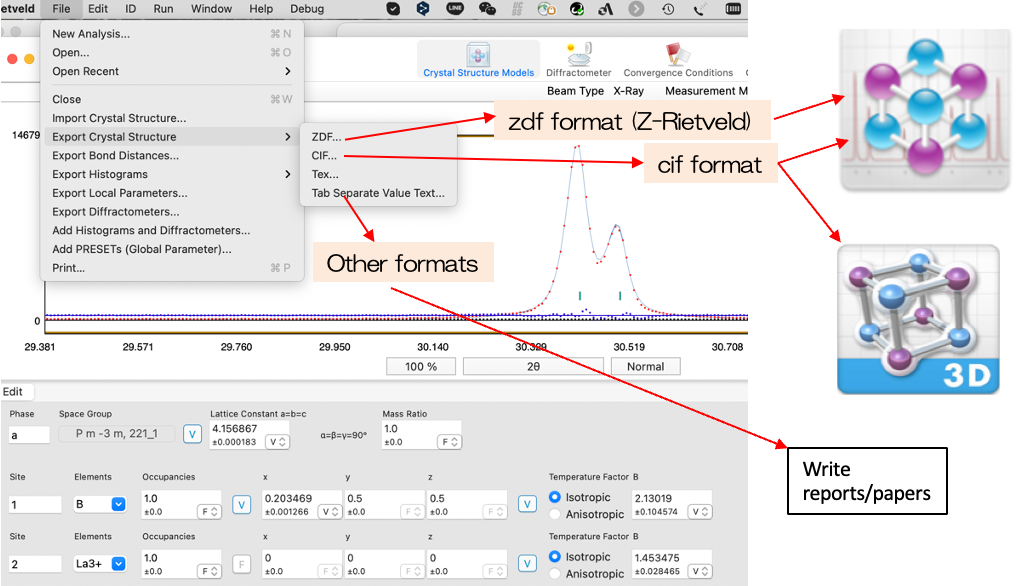
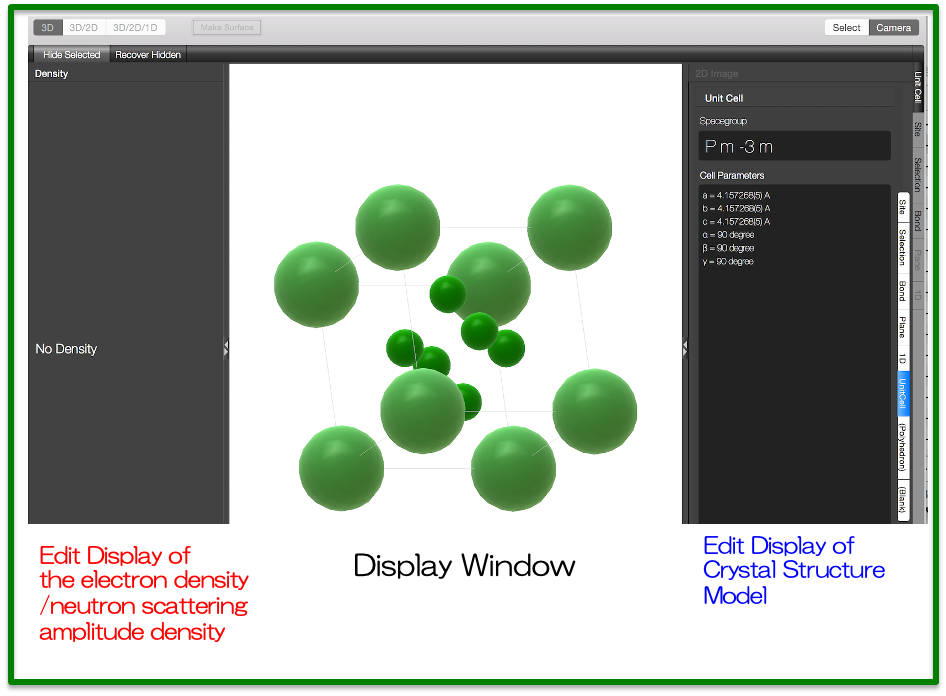
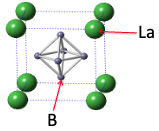
- Draw Crystal Structure with using Z-3D
Firstly, please output the cif file as shown above.
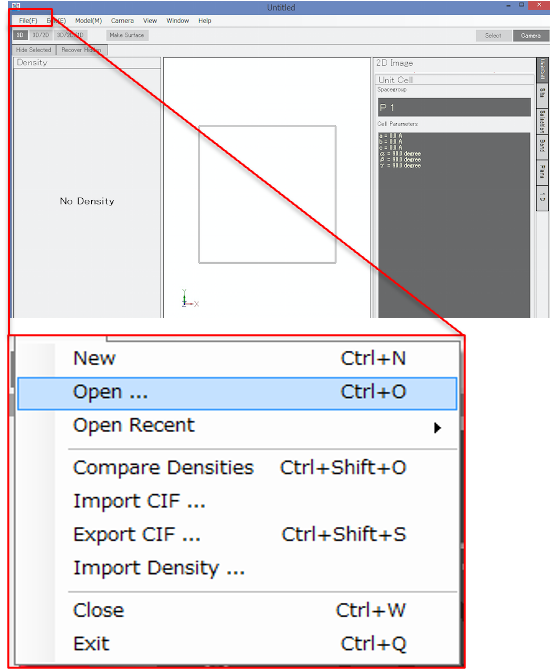
10-1. Double click Z-3D
10-2. File > Open cif file