2024.04.18 updated
(1) MEM analysis using Multiple-Histograms
In the TOF diffractometry, the detectors at low scattering angles cover much longer d spacing. The Maximum Entropy Method in Z-Rietveld 2.0.0 can deal with multiple histograms measured at different scattering angles. After the multiple-histograms Rietveld analysis, you can carry out multiple histograms MEM analysis.
Step 1) Multiple-Histogram Rietveld analysis
Select histograms and the corresponding diffractometer files. Input the structural model including all phases. Set analysis ranges & excluded regions. Finish Rietveld analysis.
Step 2) Multiple-Histogram MEM analysis
After the Rietveld analysis, you can carry out MEM in Z-Rietveld: just push MEM slab, and Run button.
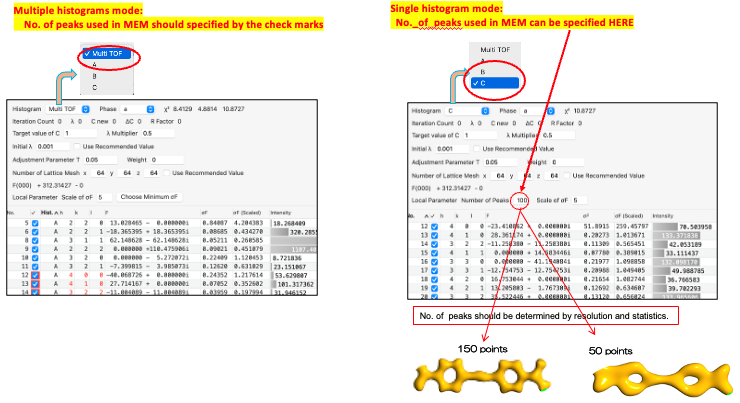
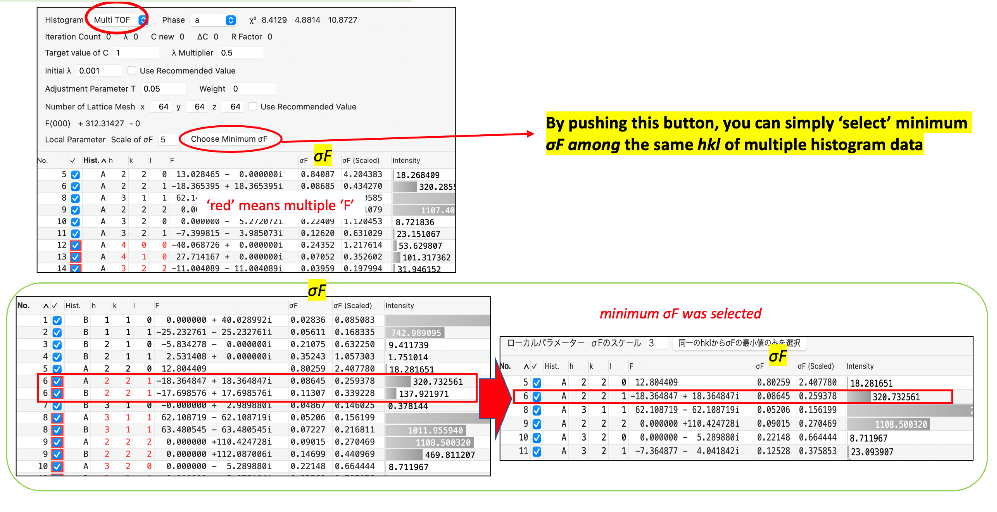
For some hkl, there are several F(hkl)’s in different banks. You can specify which F(hkl)’s is used for MEM calculation.
Here are files.
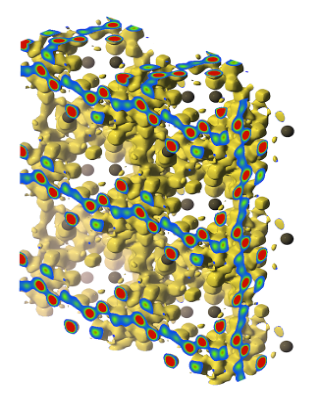
***.den: MEM density file
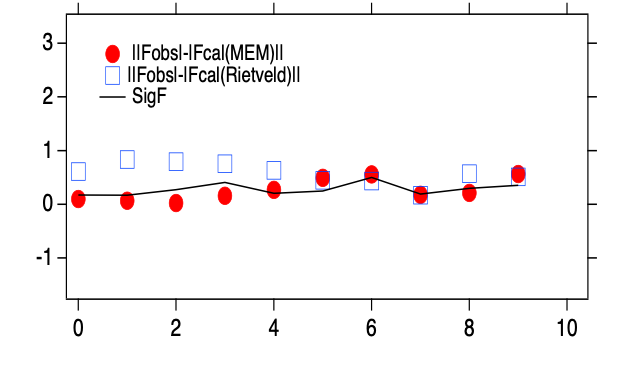
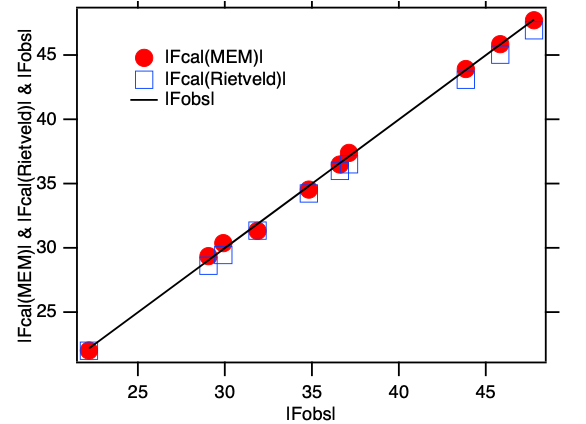
***out.txt: Calculation conditions, iteration, final C value, WRF, list of reflections as well as |FCAL(MEM)| |FCAL(Rietveld)|.
By plotting |Fobs|, |Fcal(MEM)| and |Fcal(Rietveld)| in the output file of 2.1.0, you can evaluate the improvement by the MEM analysis.
(2) Automatic Analysis for single histogram
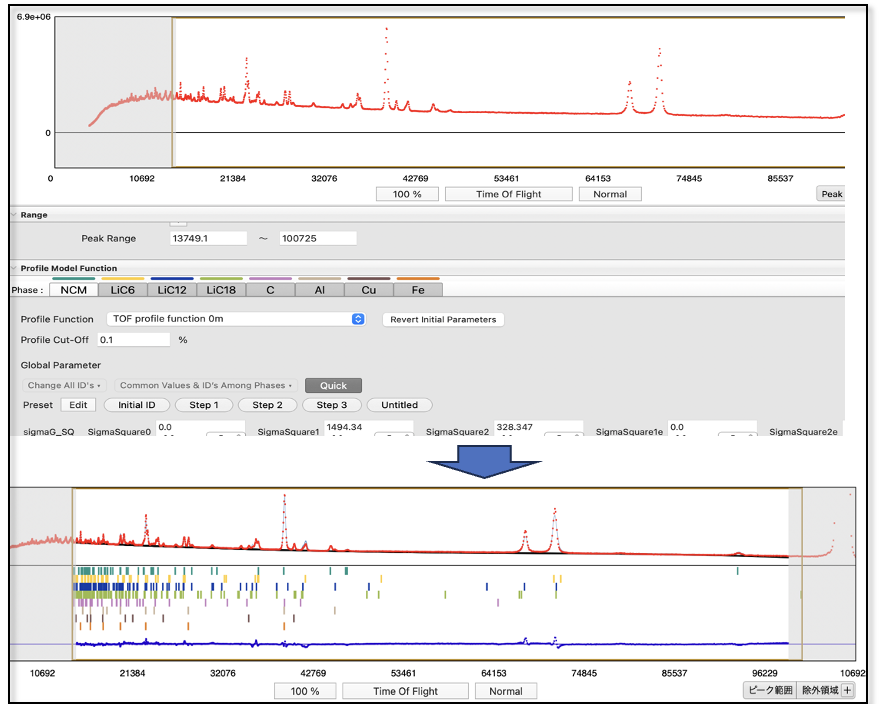
(Step 1) Select a histogram and the corresponding diffractometer file. Input the structural model including all phases. Set analysis ranges & excluded regions.
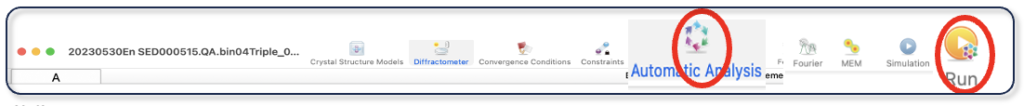
(Step 2) Select the automatic analysis slab, and check ’Yes’ for ‘Automatic Analysis’, select ‘Multiphase’, then, push ‘Run’.
About Automatic Analysis slab
Here is the automatic analysis slab. I recommend you to use them as they are. Select ‘Multiphase’ and ‘Run’.
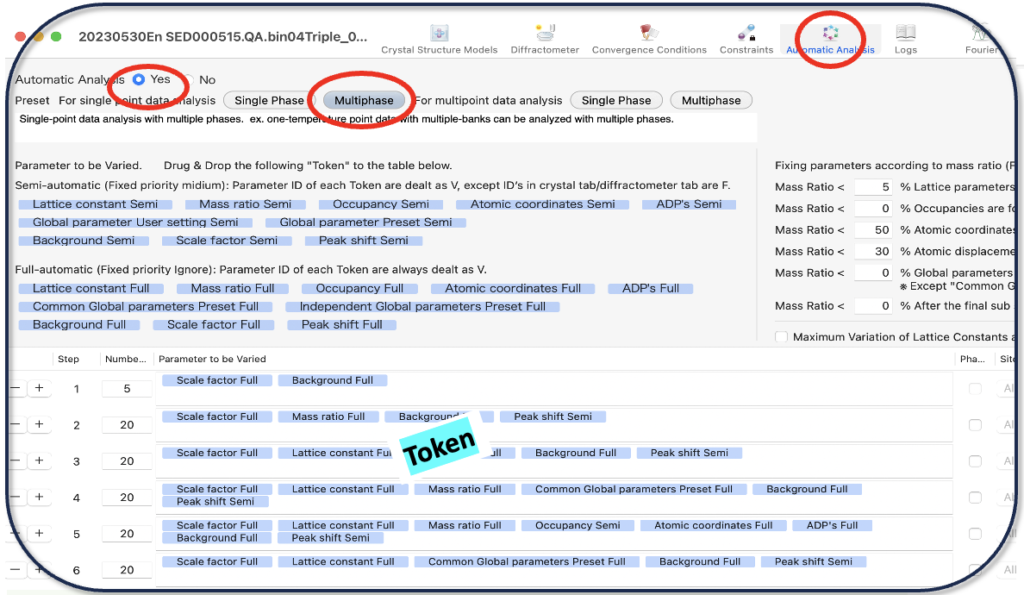
Specify the parameters to be varied in each step
You can change Token by dragg & drop, but I, initially, recommend you to use them as they are.
“Token”: a set of parameters + ‘Semi’ or ‘Full’
Full(automatic): recommended for most users: always V.
Semi(automatic): trained users who would like to control in detail.
(Ex.1) Mass ratio Full –> ID (Mass ratio) is always V even if the user specifies F
(Ex.2) Mass ratio Semi -> ID (Mass ratio) is V except ID’s in crystal tab is F.
(Ex.3) Common Global parameters Preset Full -> ID’s are always V even if the user specifies F.
Even if Mass Ratio < ? % is specified, the global parameter’s ID’s are the same as the main phase (V).
You can refine all global profile parameters as common parameters.
Constraints (parameter fixing) according to Mass Ratio
Lattice parameters; if the Mass Ratio of a phase < 5 %, the lattice parameters of the phase are forced to be fixed.
Occupancies; no condition, which means Z-Rietveld follows the ID’s specified in the crystal tab.
Atomic coordinates; if the Mass Ratio of a phase < 50 %, the atomic coordinates of the phase are forced to be fixed.
Atomic displacement parameters; if the Mass Ratio of a phase < 30 %, the atomic displacement parameters of the phase are forced to be fixed.
If the Mass Ratio of a phase is very small, it is better to fix the global parameters of the phase except that Common Global parameters Preset Full is selected.
If the Mass Ratio is very small, it might sometime be better to fix the Mass Ratio to be zero. And, add one step with a zero mass ratio.
Lattice parameters; Limit the variation of lattice parameters < ? %
(3) Automatic Analysis for multiple histograms
(Step 1) Analyze a single histogram first. Select the first histogram & the diffractometer file, and input the structural model including all phases that appear in the multiple histograms (+ analysis range & excluded regions).
(Step 2) Select the automatic analysis slab, and check ‘Automatic Analysis’, ‘Multiphase’, then, push ‘Run’.

(Step3) Open ‘Multiple Dataset Analyses Window’ by selecting this.
(Step4) Read histogram data to be analyzed.
(Step5) Give the name of the files(initial name, difference, unit).
(Step6) Specify either ‘same for all’ or ‘use the converged value for the next initial value’.
(Step7) Start Multiple-Histograms Analysis by pushing this button.
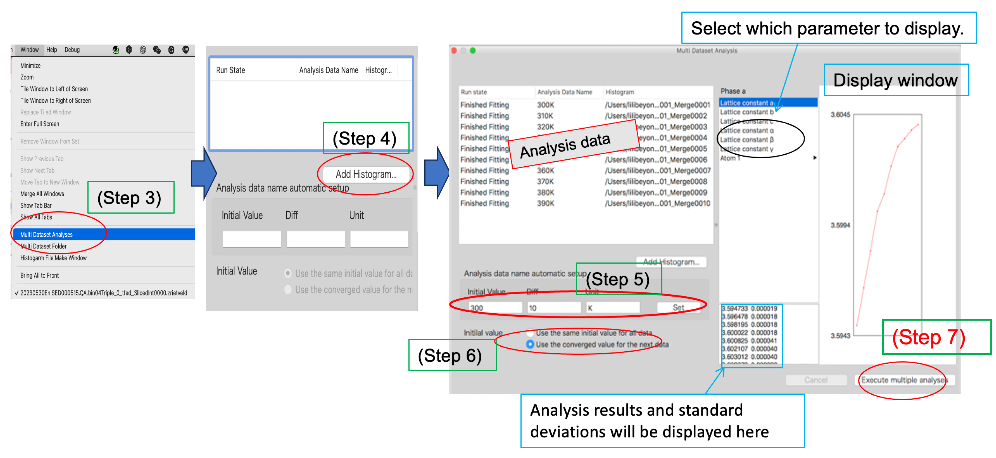
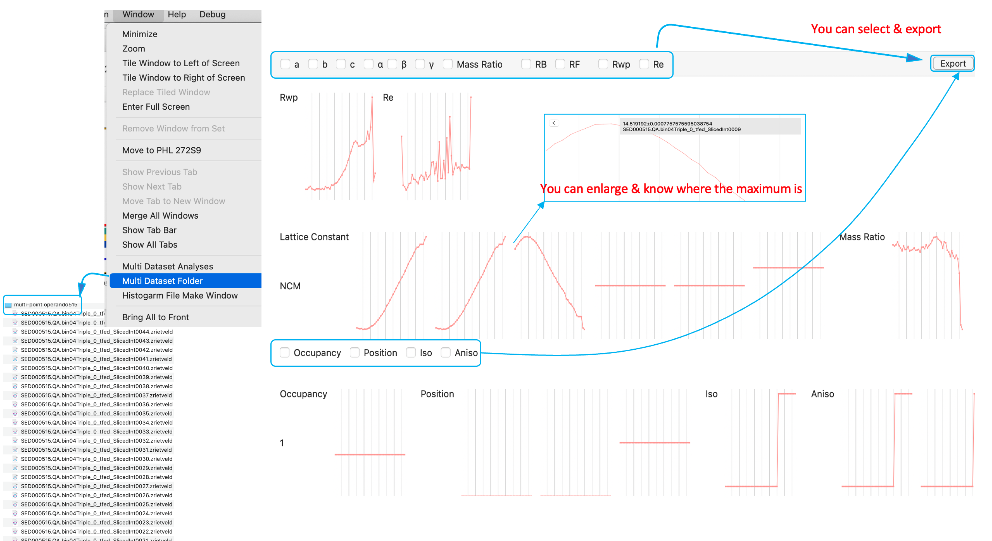
The results of the multiple-point analysis are stored in a folder, which can be shown from the window menu afterward.
Select Window > Multi Dataset Folder. Once Multi Dataset is shown, you can output some figures. You can also enlarge and know details about the obtained crystallographic parameters.