2021.9.17 last updated
- starting Z-Rietveld by double click the icon
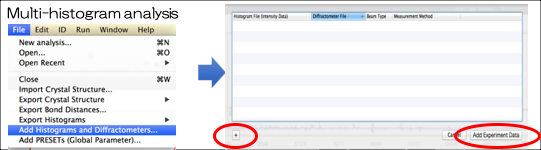
- File Menu -> New Analysis
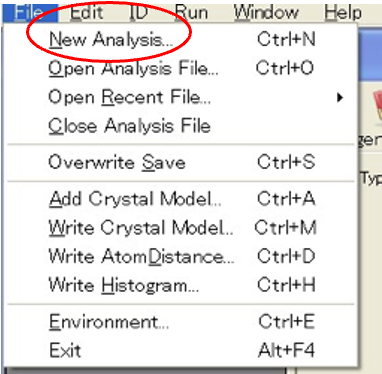
- Click ‘Add Histogram file’ and specify a histogram file (diffraction data) with the name of‘xxx.histogramIgor’.
J-PARC MLF histogram data are supplied by the instrument group. For other data, you can also make them (see corresponding section).
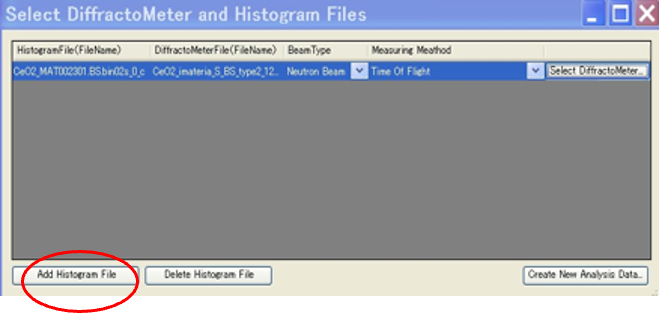
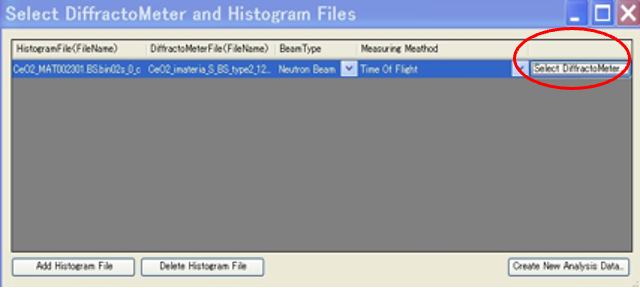
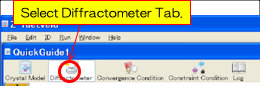
- Click ‘Select Diffractometer’ and specify a diffractometer file (the diffractometer information included) with the name of ‘yyy. zDiffractometer’. J-PARC MLF diffractometer file is supplied by the instrument group. But, you can also make them.
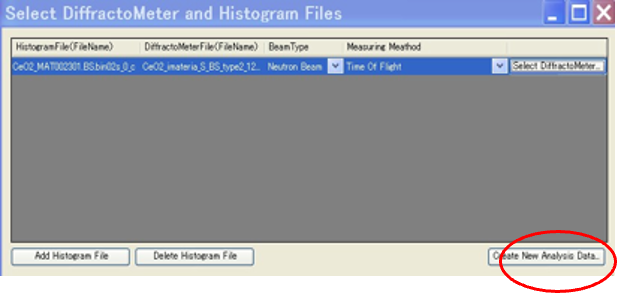
- Click ‘Create New Analysis Data…’, and input a file name ‘zzz’, then a file with a name of zzz.zrietveld is created. All of your analysis results will be stored in zzz.zrietveld. After zzz.zrietveld is created, a ‘diffraction pattern window’ is displayed. (zzz = xxx in default).
zzz.Zrietveld can be big after repeated analyses which help you to go back to previous analyses. You can restrict size of the file by ‘Preference’ of Z-Rietveld.
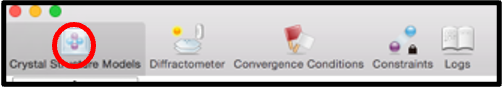
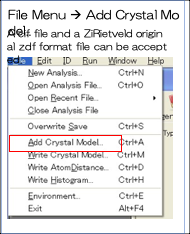
- Input & Edit crystal structure parameters First Select Crystal Structure Models Tab.
The crystal structure parameters can be input either by hand or from files.
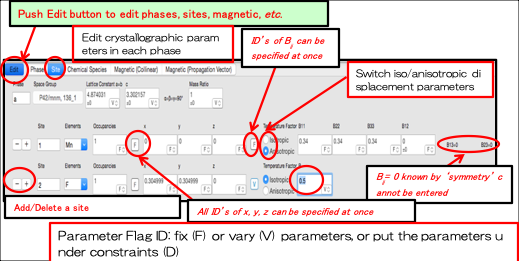
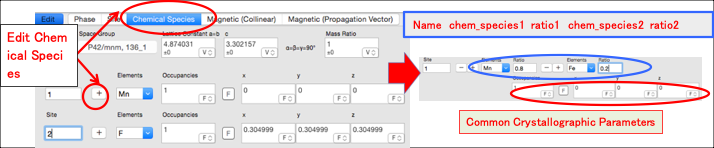
How to deal with several chemical species occupying the same site
- Specify the region to generate Bragg reflections, specify excluded regions
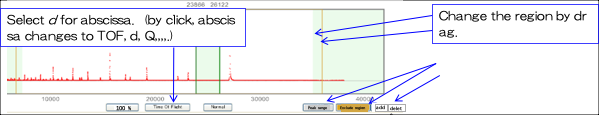
Since there are so many Bragg reflections in small TOF, it will take long time to calculate them. So, initially, d > 0.5 Å is recommended.
Impurity peaks can be removed by adding excluded regions.
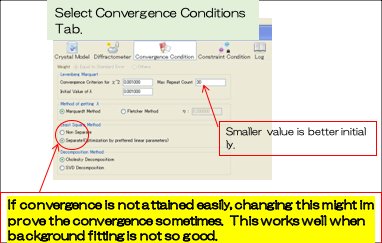
- specify refined parameters
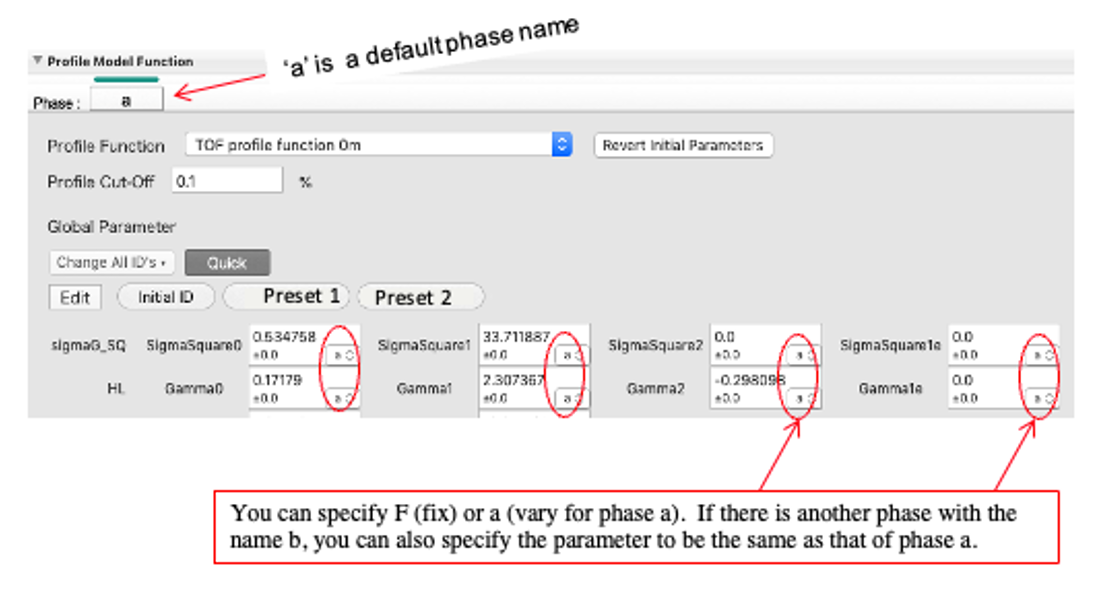
A profile function specified in .zdiffractometer file is shown.
Buttons: several buttons help your analysis
i) Revert Initial Parameters’ button; if the fitting is not improved, push ‘Revert Initial Parameters’ button. Profile parameters go back to the initial ones.
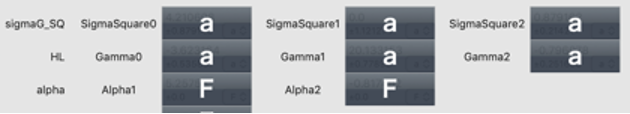
ii) Change All ID’s; initially, it is sometime recommended to select F to fix all global parameters by clicking this button.
iii) Quick button; when you place your cursor on Quick button, the present labels (F or V) will be displayed. You can toggle F/V by the click of a parameter.
iv) Preset buttons are useful; set profile parameters fixed (F) -> push Preset1 and refine -> push Preset2 and refine. In Preset1 & 2, small number of refined parameters is specified. User can customize ‘Preset’ by pushing Edit button.
v) User-defined ‘Preset’ button : push Edit button -> push ‘+’ button You can change name by pushing ‘Untitled’ -> push Edit button, then present ID’s are memorized
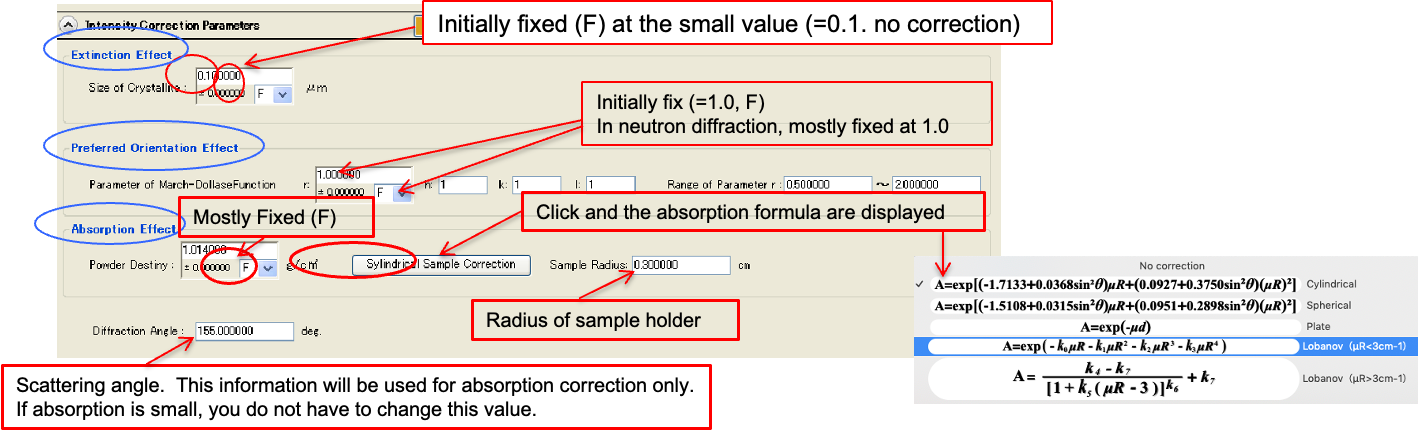
Intensity Correction parameters
:Extinction Effect (crystallite size), Preferred Orientation Effect, Absorption Effect
Scale factors and conversion parameters
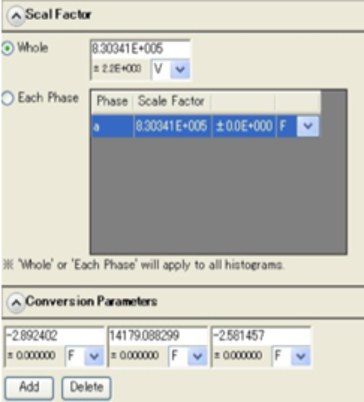
If you notice that the scale factor is too large, change the initial value. Conversion between t (time-of-flight) and d-spacing; written in the xxx.zDiffractometer file supplied by the instrument group. If necessary, you can add additional conversion parameter terms.
- Start Rietveld analysis, change conditions and continue analysis.
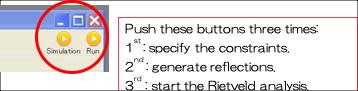
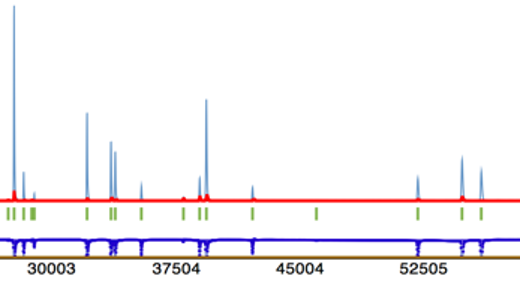
This example shows that the scale factor is too large after the 2nd button-push. Then decrease the scale factor by 1/10 and push the 3rd button.
Generally, it is recommended to repeat simulation until the calculated pattern looks similar to the observed one. The calculated peak positions are required to be almost the same as the observed ones.
Hints; You can add histogram during the analysis
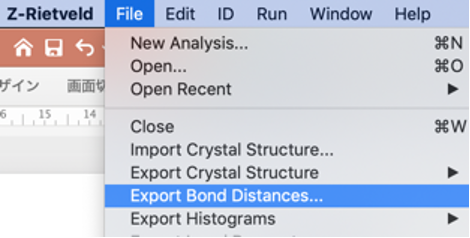
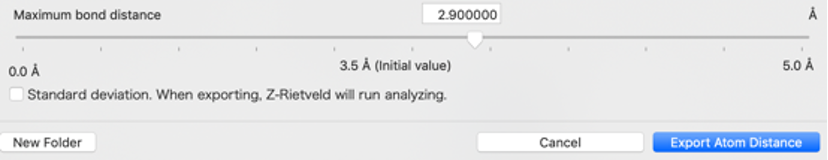
Calculate interatomic distances & bond angles
Export Crystal Structure Model
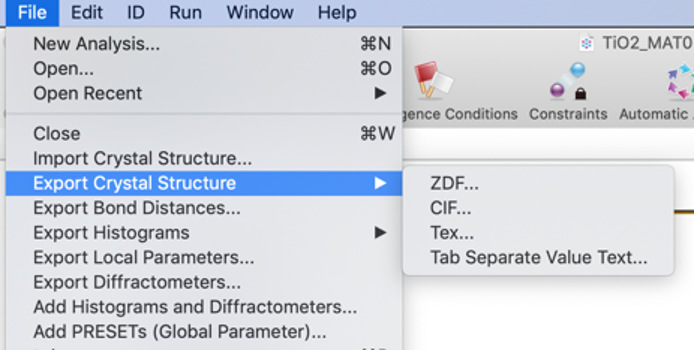
Tab-Separate format allows error format specification
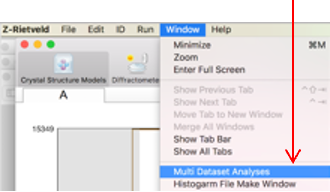
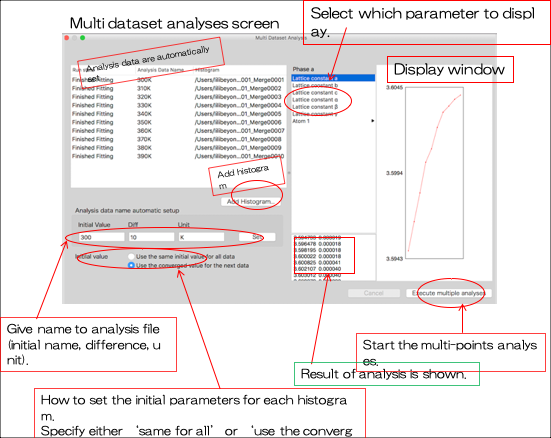
Automatic analysis of continuous multi-points data (datasets: temperature, pressure, etc.)
After a usual analysis for one data, push this button.
Fourier Analysis / MEM Analysis using Z-Rietveld
After Rietveld analyses, you can quickly move on to Fourier or MEM analyses by just click the Fourier analysis tab or the MEM analysis tab.
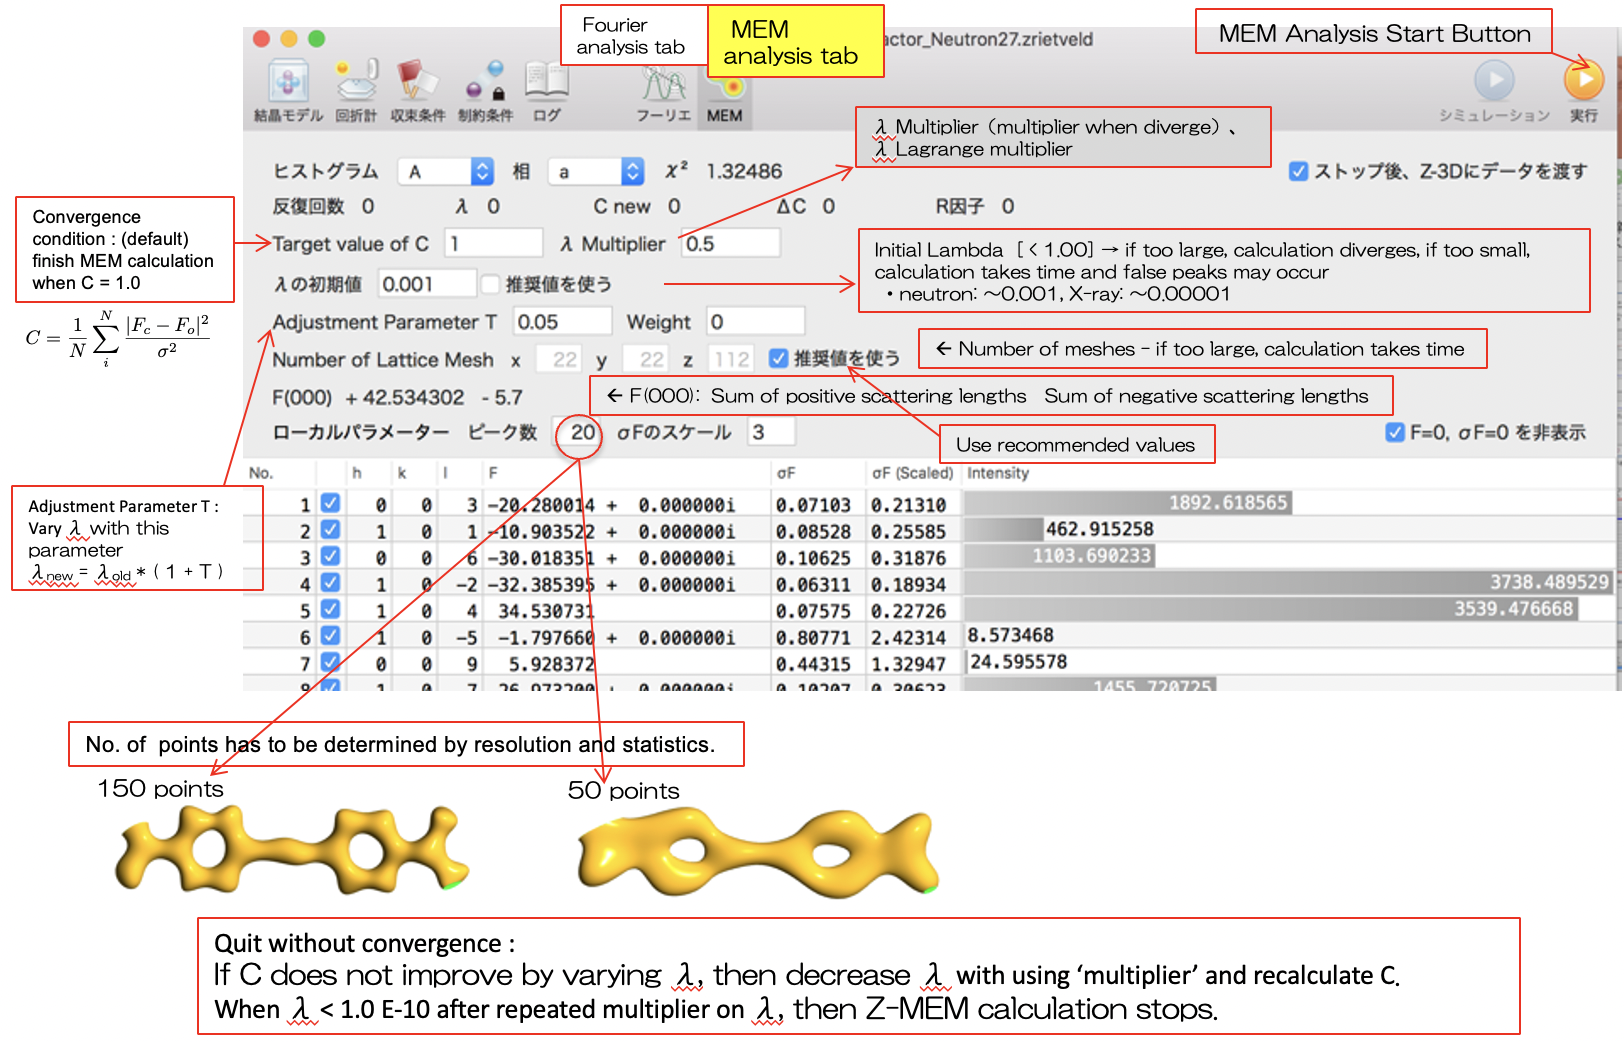
Quit without convergence :
If C does not improve by varying λ, then decrease λ with using ‘multiplier’ and recalculate C. When λ < 1.0 E-10 after repeated multiplier on λ, then Z-MEM calculation stops.
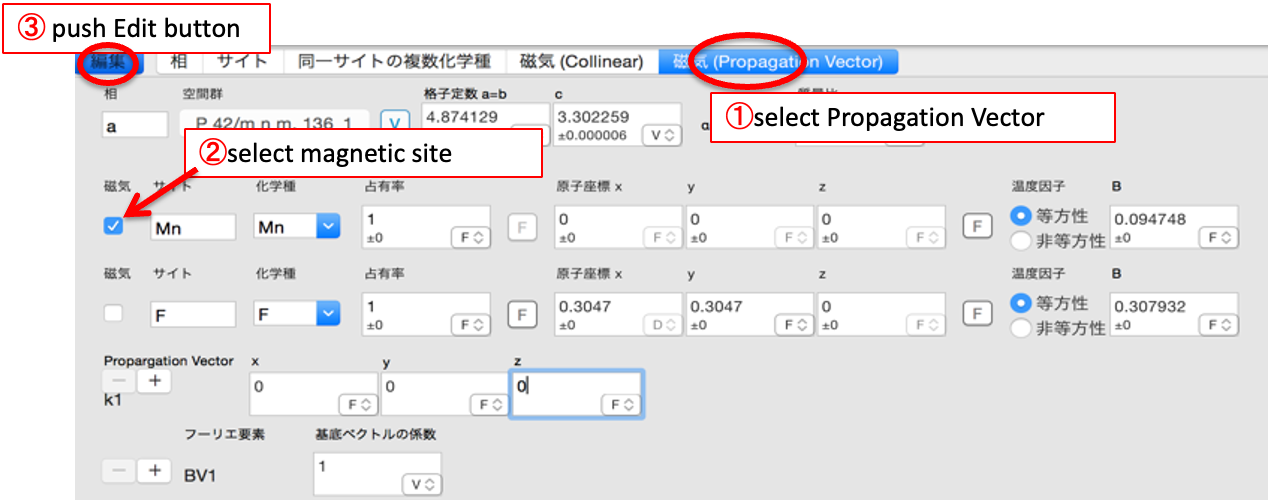
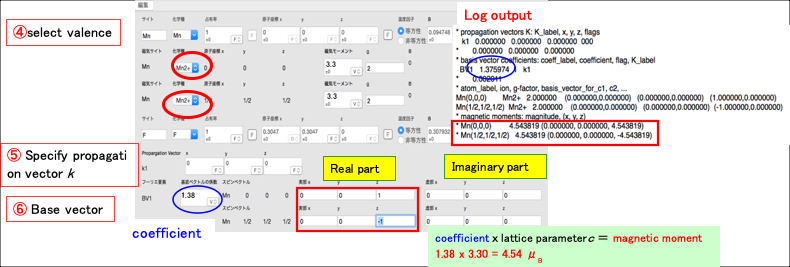
Magnetic Structure Analysis using Propagation Vector
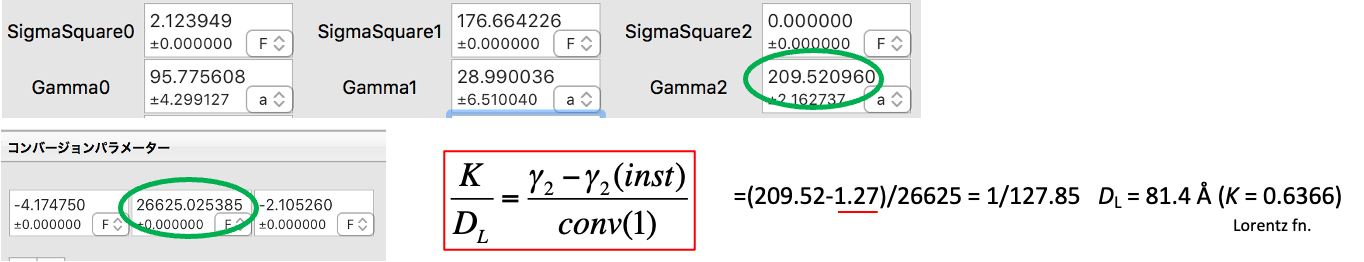
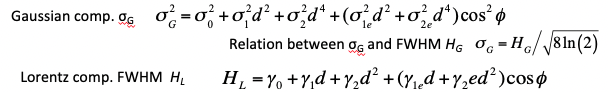
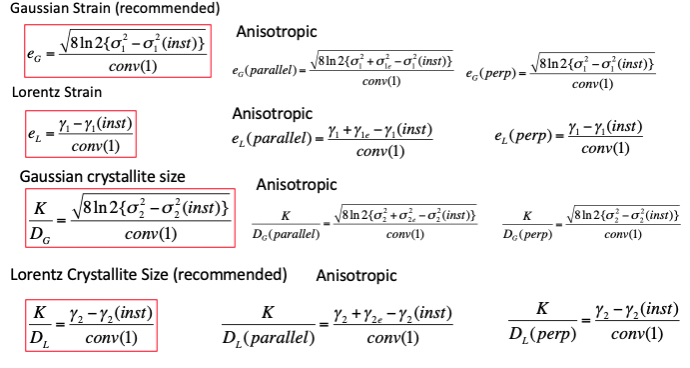
Effective Strain, Effective Crystallite Size for type0, type0m profile functions
To obtain the effective strain / effective crystallite size from peak-width parameters, it is necessary to extract instrument contribution. If the broadening due to those effect is comparable with the diffractometer widths, careful subtraction is necessary. In the case of the high resolution diffractometers of J-PARC MLF, you may sometime be approximating the instrument function with Gaussian σ1 only, with γ1、γ2、σ2 close to zero, which makes analysis easier.
Fitting is carried out in t (msec). So, σG2[msec.], HL[msec].

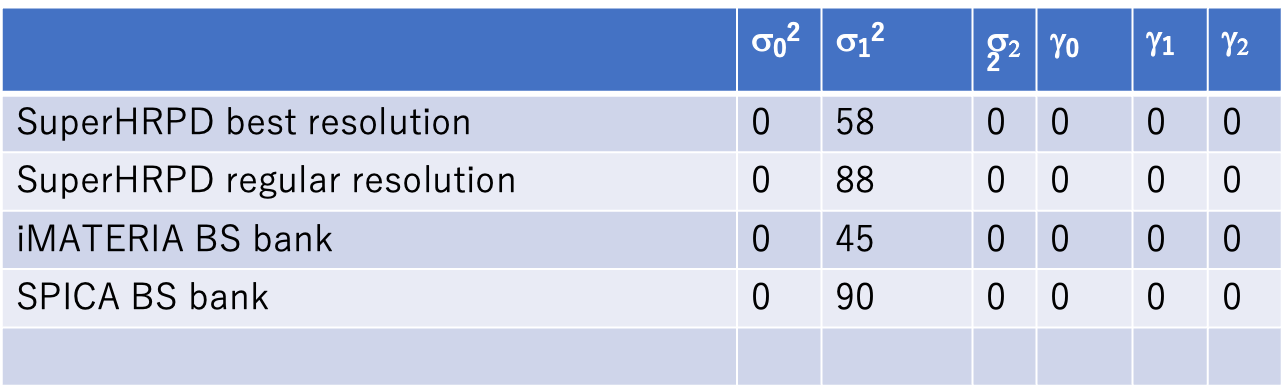
s02 s12 s22 g0 g1 g2 SuperHRPD best resolution 0 58 0 0 0 0 SuperHRPD regular resolution 0 88 0 0 0 0 iMATERIA BS bank 0 45 0 0 0 0 SPICA BS bank 0 90 0 0 0 0
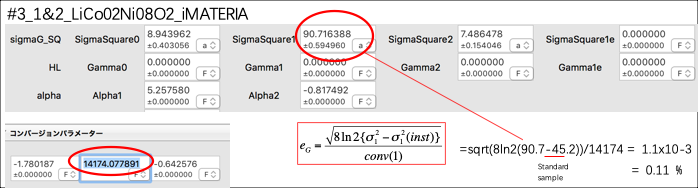
Examples
1) Effective Strain
2) Effective Crystallite Size